

- News
- Investing
- Markets

At a glance
- The US Treasury 10-year rates are at a record high not seen since 2007. Market surprised with “higher-for-longer” rhetoric;
- Yield curve is slowly “normalising”. Is it an opportunity, or is it a threat?
- Markets do not appear to have consensus – this is a prime time for active and fundamental fund management focusing on quality.
The most notable market story at the end of Q3 this year was perhaps the 10-year US Treasury rate jumping to the highest level since 2007. Fed left the US rates unchanged in the September Federal Open Market Committee meeting. However, policymakers were still anticipating another rate hike this year, surprising the market with the hawkish “higher-for-longer” rhetoric.
The US economy was performing quite well (2Q23 US GDP growth +2.1%1 year on year)1. Spending remained relatively healthy, and while it has weakened a bit, job data remained positive. The US appears poised to achieve the vaunted ‘soft-landing’. Fed officials lowered their forecasts for unemployment and increased their growth predictions in the last week of September.
From an investor’s point of view, this strength meant central bankers would feel more comfortable keeping rates higher for longer – consistent with what we have been hearing.
This expectation has grown into the quarter, and in the case of good news being bad news, has been hurting equity performance. Global equity indices fell over Q3 on this divergence of market expectation and central bank rhetoric, mainly because most investors didn’t believe a soft landing was achievable and, thus, priced in expectations of a more immediate need for rate cuts in the short term to balance the succession of rate hikes. There is, of course, the potential for inflation to stick around longer or bounce off the current levels if central banks cut rates too quickly.
Let’s focus in on the US yield curve, which inverted in April 20222. Usually, the yield curve slopes upwards to compensate investors for holding bonds longer. The yield curve inverts when investors “flock” to the short end of the yield curve, favouring shorter duration over the longer duration. This is an indication that investors are expecting a slower pace of inflation and weaker economic growth in the future – and historically, a recession tends to follow a year after the inversion.However, the data variance is large and there are occasional false positives – and we certainly seem to be potentially getting away with this hard landing that everyone is expecting.
Indeed, several Central Bank decision makers from the US, EU and UK began cautioning that interest rates were approaching their peak.
This could have implications for fixed-income investments. Yields typically fall once Central Banks stop hiking rates, meaning prices for the longer end of the yield curve go up, making it more attractive to hold longer-duration bonds again. We are thus positioning ourselves such that when the current preference for short duration ends, we won’t find ourselves at the back end of the queue.
Next, moving to credit, yield spreads in the US have generally compressed as Treasury yields have risen, reflecting the resilience of the underlying US economy. However, the rising likelihood of higher-for-longer interest rates has also amplified credit risk broadly, making proper due diligence for quality credit (and selective distressed opportunities) even more valuable than usual.
European and UK markets exhibits similar stories to the US, though we are seeing a flattish economy in some cases.
China, the world’s second largest economy, continues to struggle with issues in the property market. However, most market participants agree that valuations across the board are overly pessimistic, giving rise to opportunities to find some gems amongst the rough at low prices.
Broad market is jumpy, as half of the average investors follow the crowd into the Magnificent Seven – which stumbled heavily in the last session of the quarter after a similar fall in August. The other average investor seeks the “safe haven” of fixed deposits, believing they are better off hiding there until the “storm is over”.
Our research, however, shows there are other options:
Source: MSCI. MSCI makes no express or implied warranties or representations and shall have no liability whatsoever with respect to any MSCI data contained herein. The MSCI data may not be further redistributed or used as a basis for other indices or any securities or financial products. This report is not approved, endorsed, reviewed or produced by MSCI. None of the MSCI data is intended to constitute investment advice or a recommendation to make (or refrain from making) any kind of investment decision and may not be relied on as such.
© S&P Dow Jones LLC 2023. All rights reserved.
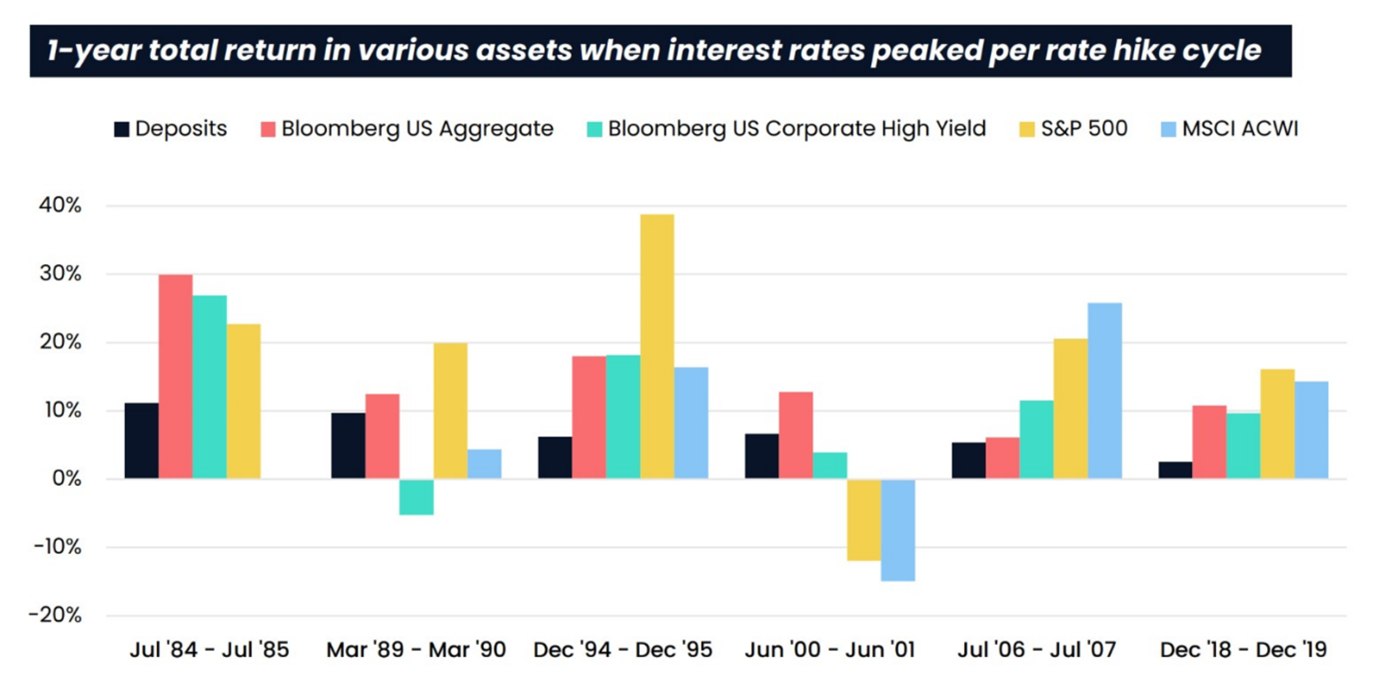
Having looked at 40 years’ worth of data, we found that amidst the six rate hike cycles, in the year following the interest rate peak, Investment Grade (“IG” – represented by the red bars in the graph above) bonds have always outperformed fixed deposits (black bars). This makes a lot of sense since interest rate increases are advantageous to fixed-income assets. At the same time, quality IG bonds tend to have fewer downside risks in a credit event triggered by increasing interest rates.
This sums up our general approach in this rather volatile market environment. There is little market consensus, and investors tend to be nervous when faced with unexpected news, even if they are good, leading to negative market reactions. However, this is the prime time to look for bargains in quality assets across equities and bonds – selective bottom-up exposure for good companies instead of looking down at the macro or even sector level. Last year’s acute pullback in the financial markets has thrown up fresh opportunities across the risk spectrum. By maintaining our strategy of sticking to quality plays across equities and bonds, we give ourselves the most attractive risk-reward in this space.
Past performance is not indicative of future performance.
The value of an investment in equities and shares may go up and down. You may get back less than the amount invested. This is different to the capital security typically associated with bank
deposits held in cash.
Sources:
1 Trading Economics
2 FRED Economic Data

Most popular articles


Most recent articles